Python Class To Get Descriptive Statistics
Contents
![]()
Python Class To Get Descriptive Statistics#
I'm going to create a python class that allows us to reference an object and that its attributes are information related to the main descriptive statistics of a sample of n observations. This is an easy exercise to identify how the logic of classes, objects, functions and attributes works in python.
First of all it is important to identify the formulas of all the descriptive statistics that we are going to build in code using python. It is also important to say that the main idea of this exercise is not to use any pre-existing Python modules.
What Are We Going To Calculate?#
Let's compute the following basic descriptive statistics: the mean, standard deviation, variance, median, kurtosis, skewness, and coefficient of variation. The formulas for those descriptive statistics are as follows:
Mean:
Standard Deviation:
Variance:
Kurtosis:
Skewness:
Coefficient of Variation:
Now that we have the formulas of what we want to calculate, we simply have to set up the class and start creating methods for each statistic, even though we could also generate them as attributes of the object.
class statistics:

  def __init__(self,lst):
    self.lst = lst
    return None

  def mean(self):
    return sum(self.lst) / len(self.lst)

  def stand_dev(self):
    return (sum([(i - self.mean())**2 for i in self.lst]) / (len(self.lst)-1))**0.5

  def variance(self):
    return self.stand_dev()**2

  def median(self):
    return (sorted(self.lst)[len(self.lst)//2] if len(self.lst)%2 != 0
            else (sorted(self.lst)[len(self.lst)//2-1]+sorted(self.lst)[len(self.lst)//2]) / 2)

  def kurtosis(self):
    return  sum([(i - self.mean())**4 for i in self.lst]) / (len(self.lst)*self.stand_dev()**4)

  def Skewness(self):
    return  sum([(i -self.mean())**3 for i in self.lst]) / (len(self.lst)*self.stand_dev()**3)

  def coeff_variation(self):
    return self.stand_dev() / abs(self.mean())
Let’s Test The Class#
That's it, our class has different methods that allow the object to calculate each statistic, let's try it!. To test our class we are going to generate a normal distribution using numpy, which has approximately mean 10, standard deviation 2.5 and with n equal to 100
import numpy as np
# Let's create the array
lst = np.random.normal(10,2.5,1000)

my_object = statistics(lst) # Nos let's create the object and use the methods

print(f'Mean = {my_object.mean()}')
print(f'Standard Deviation = {my_object.stand_dev()}')
print(f'Variance = {my_object.variance()}')
print(f'Median = {my_object.median()}')
print(f'Kurtosis = {my_object.kurtosis()}')
print(f'Skewness = {my_object.Skewness()}')
print(f'Coefficient of Variation = {my_object.coeff_variation()}')
Mean = 10.04895481625352
Standard Deviation = 2.477276689127902
Variance = 6.1368997944965
Median = 9.998811286033765
Kurtosis = 3.1259615742183056
Skewness = -0.025865929977696902
Coefficient of Variation = 0.24652083071575473
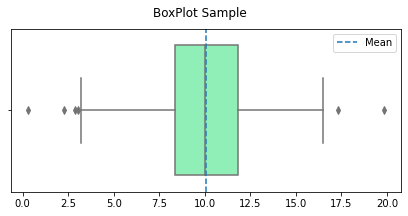
Now that we know some descriptive statistics of this sample we can additionally visualize a BoxPlot of the sample
import seaborn as sns
import matplotlib.pyplot as plt
fig = plt.figure(figsize=(7,3))
plt.suptitle('BoxPlot Sample')
sns.boxplot(x=lst,palette='rainbow')
plt.axvline(my_object.mean(),label='Mean',linestyle='--')
plt.legend()
plt.show()
Methods or Attributes…#
Now we are going to build the same class but we change things a bit... The idea now is that each descriptive statistic is configured as an attribute of the object and not as a method
class statistics:

  def __init__(self,lst):
    self.lst = lst
    # Let's create more attributes
    self.mean = sum(self.lst) / len(self.lst)
    self.stand_dev = (sum([(i - self.mean)**2 for i in self.lst]) / (len(self.lst)-1))**0.5
    self.variance = self.stand_dev**2
    self.median = (sorted(self.lst)[len(self.lst)//2] if len(self.lst)%2 != 0
            else (sorted(self.lst)[len(self.lst)//2-1]+sorted(self.lst)[len(self.lst)//2]) / 2)
    self.kurtosis = sum([(i - self.mean)**4 for i in self.lst]) / (len(self.lst)*self.stand_dev**4)
    self.skewness = sum([(i -self.mean)**3 for i in self.lst]) / (len(self.lst)*self.stand_dev**3)
    self.coeff_variation = self.stand_dev / abs(self.mean)

  # Now let's create a summarize method
  def summarize(self):
    print(f'Mean = {self.mean}')
    print(f'Standard Deviation = {self.stand_dev}')
    print(f'Variance = {self.variance}')
    print(f'Median = {self.median}')
    print(f'Kurtosis = {self.kurtosis}')
    print(f'Skewness = {self.skewness}')
    print(f'Coefficient of Variation = {self.coeff_variation}')
my_object = statistics(lst)
my_object.summarize()
Mean = 10.04895481625352
Standard Deviation = 2.477276689127902
Variance = 6.1368997944965
Median = 9.998811286033765
Kurtosis = 3.1259615742183056
Skewness = -0.025865929977696902
Coefficient of Variation = 0.24652083071575473
Some Conclusions#
Understanding the differences between concepts such as methods and attributes is important if you want to start building more complex classes and packages. Both methods and attributes have their special features and can be used in certain ways. I invite you to think and create classes with python for any kind of thing that comes to mind.